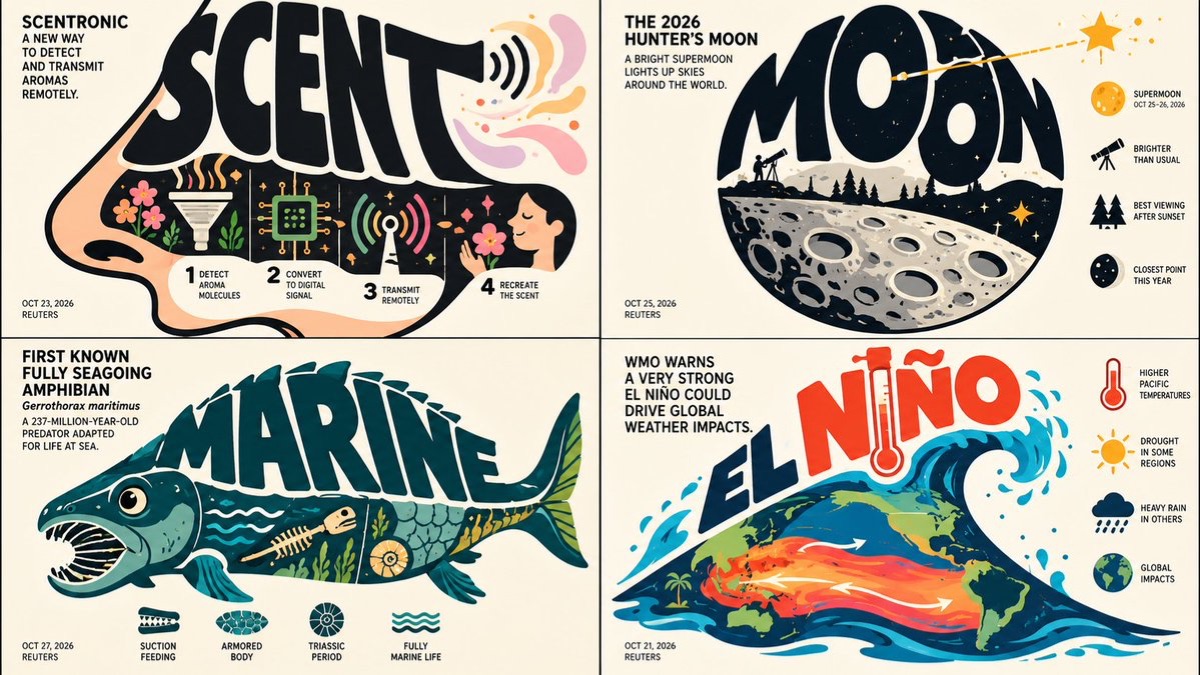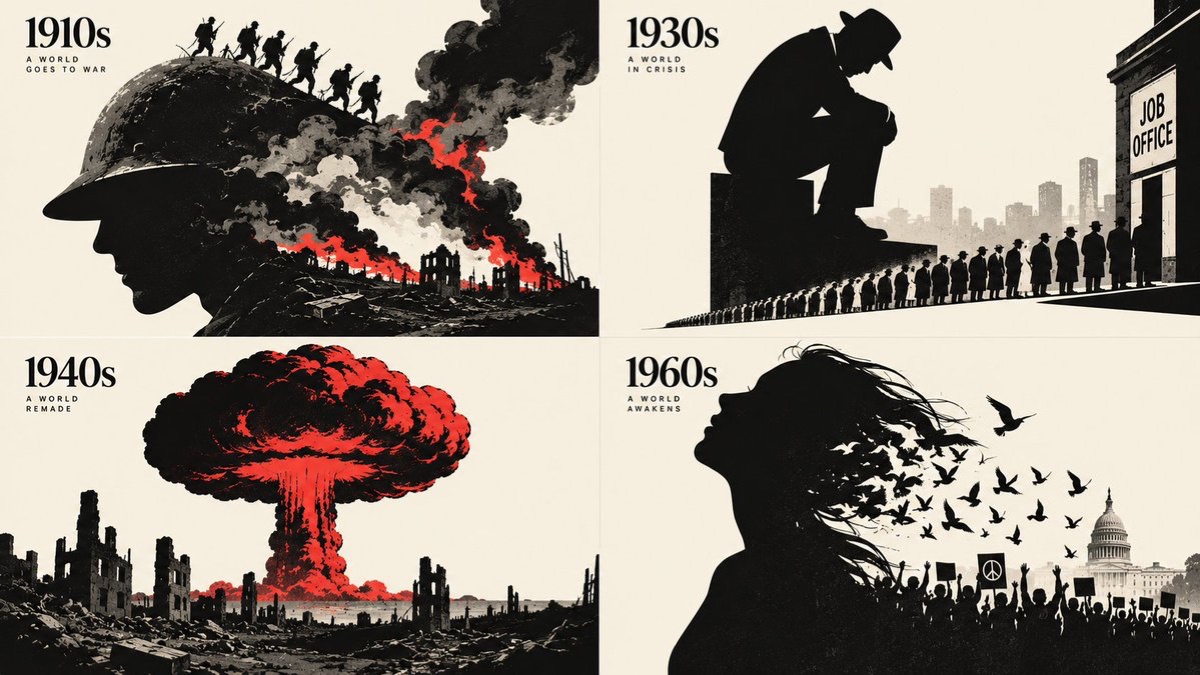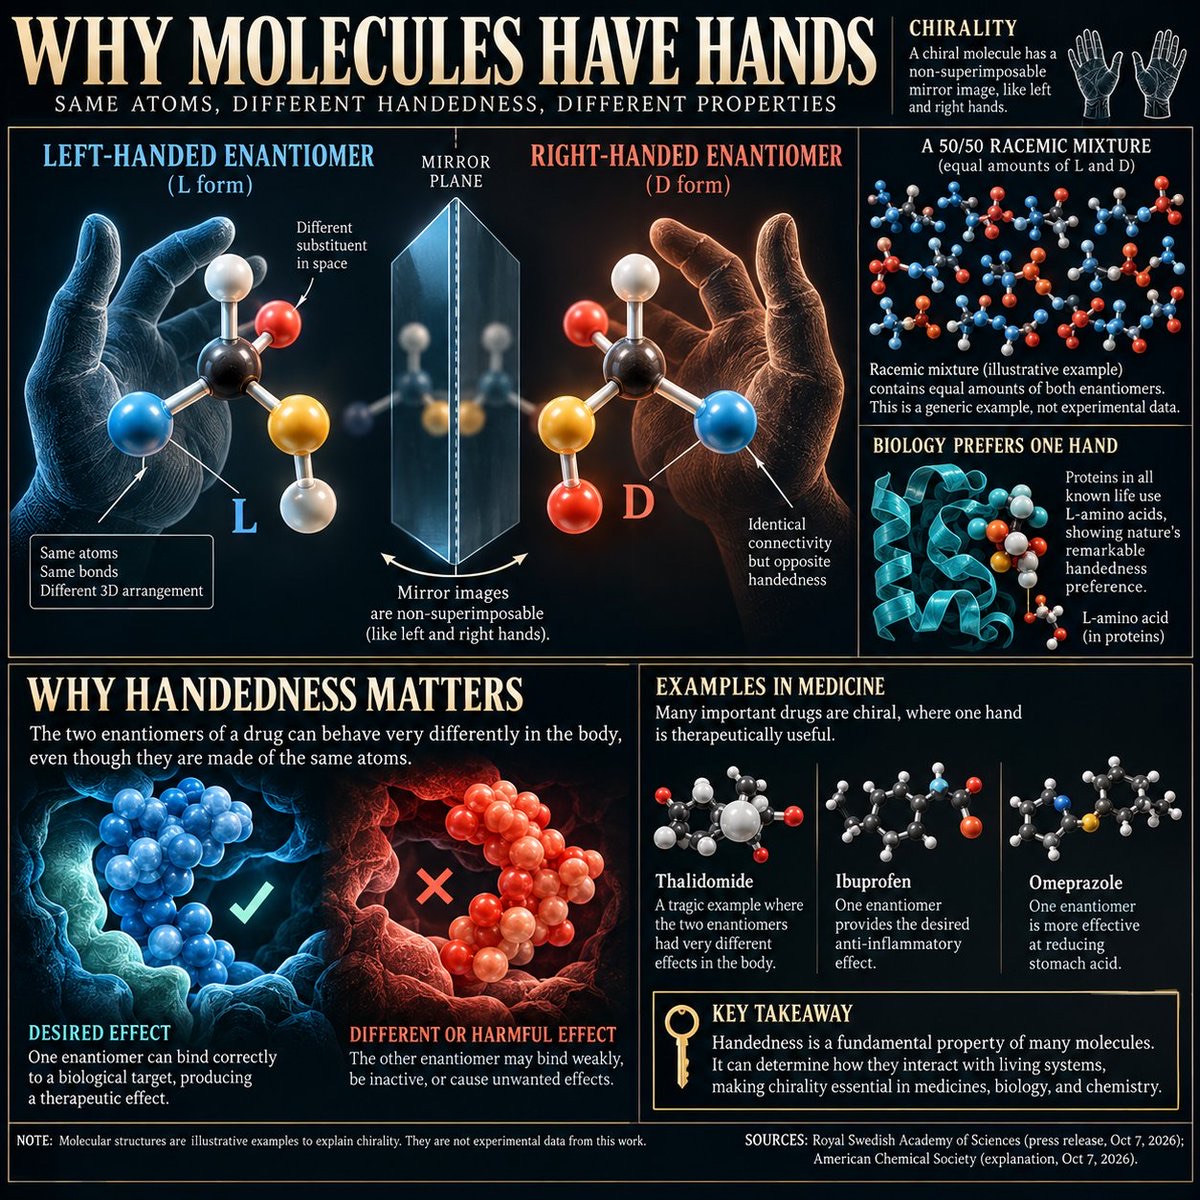

Image · Nano Banana
News-Topic-Adaptive Infographic Design
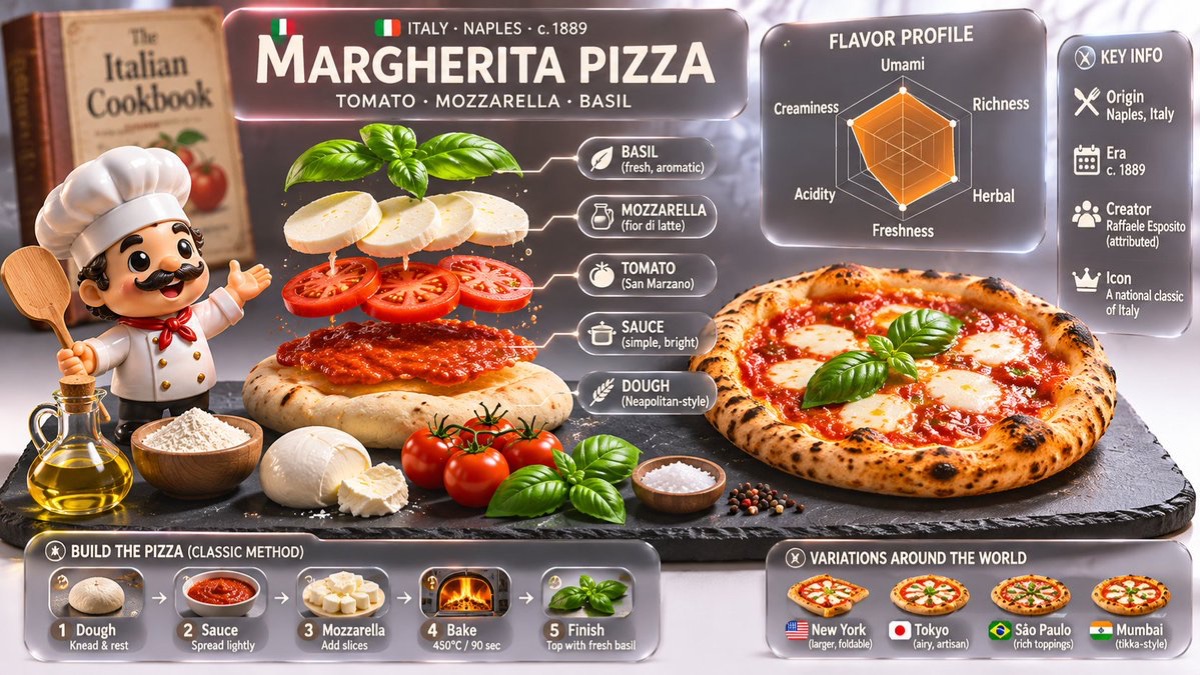
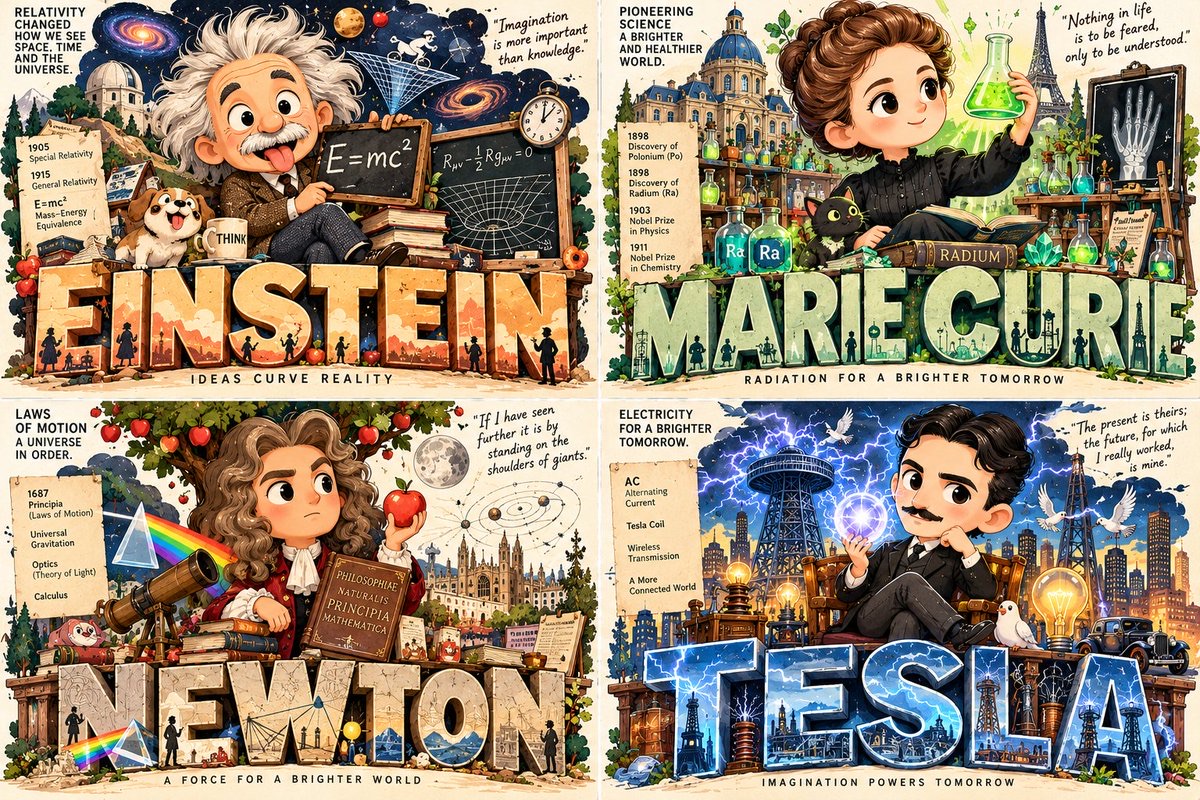
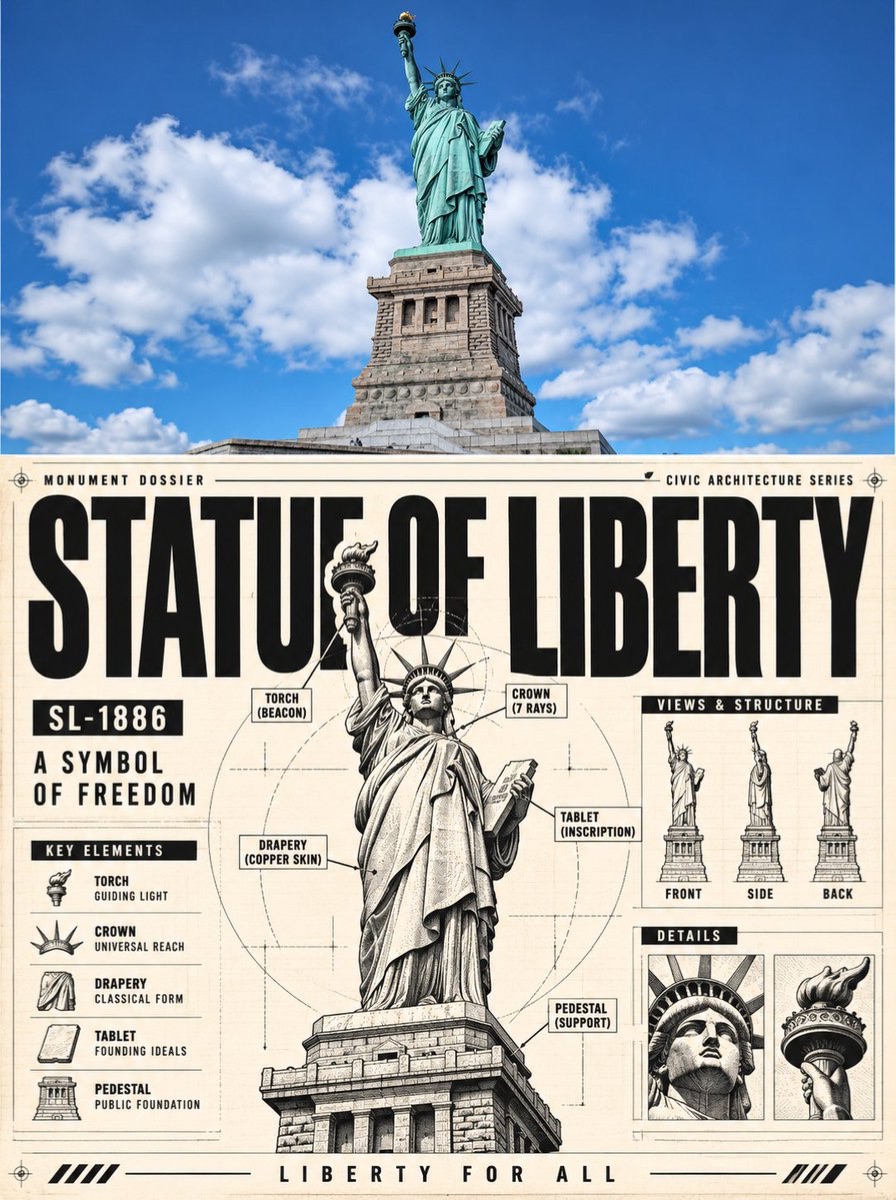
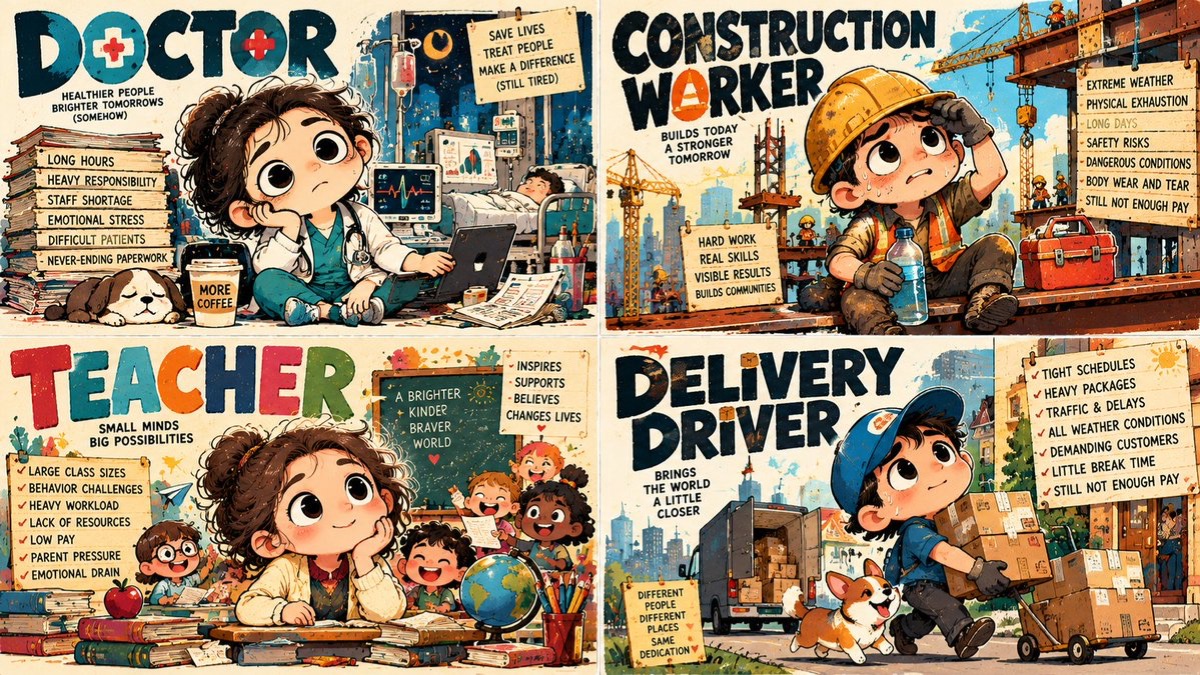
Choose a suitable central visual structure based on the news topic and evidence, then organize the methodology, metrics, evidence, conclusions, and sources to create a clear, well-structured infographic.
 Gadgetify@Gdgtify
Prompt
1:1, AI picks a topic that is in the news: TOPIC=[...] Let: H = set of candidate hero structures H = { map, timeline, ranking, flowchart, network, breakdown, comparison_matrix, layered_system, lifecycle, dashboard } For each h ∈ H: Score(h) = 0.25 * explanatory_fit(h, TOPIC) + 0.20 * data_compatibility(h, TOPIC) + 0.18 * viewer_clarity(h) + 0.14 * visual_memorability(h) + 0.10 * annotation_efficiency(h) + 0.08 * section_coherence(h) + 0.05 * editorial_elegance(h) Choose: H* = argmax Score(h) Then infer section set S: S = { header, hero_panel(H*), methodology, metric_taxonomy, evidence_region, takeaways, sources } For each evidence item e: PlacementScore(e) = 0.32 * importance + 0.23 * readability + 0.18 * novelty + 0.14 * quantifiability + 0.13 * visual support Use top-ranked items for prominent placement. Design objective: J = 0.24 information_clarity + 0.21 * structural_fit + 0.16 * visual_hierarchy + 0.14 * topic_relevance + 0.10 * scannability + 0.08 * source_integrity + 0.07 * aesthetic_consistency Reject: - rigid one-size-fits-all composition - irrelevant chart types - arbitrary icons - unsupported factual numbers - overcrowded tables - decorative panels that do not add explanation1:1, AI picks a topic that is in the news: TOPIC=[...] Let: H = set of candidate hero structures H = { map, timeline, ranking, flowchart, network, breakdown, comparison_matrix, layered_system, lifecycle, dashboard } For each h ∈ H: Score(h) = 0.25 * explanatory_fit(h, TOPIC) + 0.20 * data_compatibility(h, TOPIC) + 0.18 * viewer_clarity(h) + 0.14 * visual_memorability(h) + 0.10 * annotation_efficiency(h) + 0.08 * section_coherence(h) + 0.05 * editorial_elegance(h) Choose: H* = argmax Score(h) Then infer section set S: S = { header, hero_panel(H*), methodology, metric_taxonomy, evidence_region, takeaways, sources } For each evidence item e: PlacementScore(e) = 0.32 * importance + 0.23 * readability + 0.18 * novelty + 0.14 * quantifiability + 0.13 * visual support Use top-ranked items for prominent placement. Design objective: J = 0.24 information_clarity + 0.21 structural_fit + 0.16 visual_hierarchy + 0.14 topic_relevance + 0.10 scannability + 0.08 source_integrity + 0.07 aesthetic_consistency Reject: - rigid one-size-fits-all composition - irrelevant chart types - arbitrary icons - unsupported factual numbers - overcrowded tables - decorative panels that do not add explanation
How to use
Usage suggestion: Replace [TOPIC] with a specific news topic, and prepare reliable data and sources; suitable for topics that need explanatory structures such as comparisons, timelines, processes, or relationship networks.