Image · GPT Image 2.5
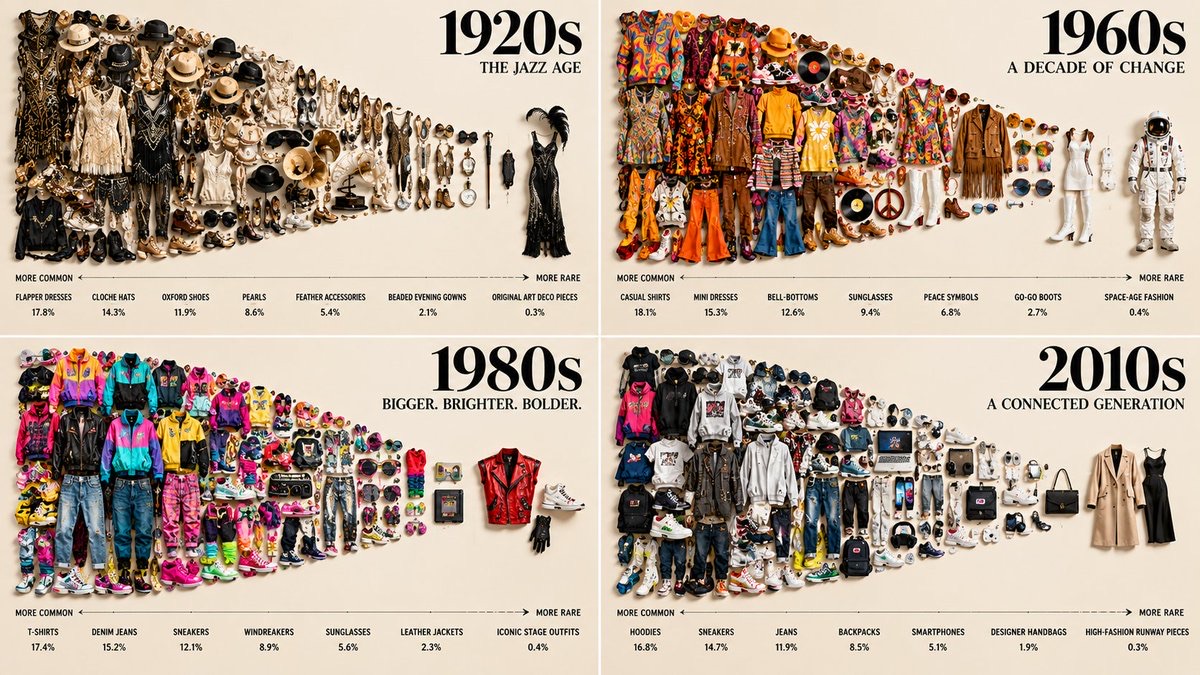
Fashion Density Infographic by Decade
Generates a top-down flat-lay of clothing grouped by decade, using variations in item density to visually show common versus rare items.
 Gadgetify@Gdgtify
Prompt
2x2 grid, 16:9, do this for fashions of different decades: A top-down flat-lay where [THEME] objects are packed by real-world frequency, the most common swarming densely on one side and the rarest standing alone with open space on the other, the density distribution forming the silhouette of [SHAPE] ::5
Frequency Logic: AI_INFER 40–60 themed objects ranked by true rarity or commonness, packed so visual density directly encodes frequency — abundance reads as crowding, rarity as isolation — the density gradient legible at a glance ::5
Composition: Density-graded packing, smooth crowd-to-sparse transition, clean silhouette edge, generous margin ::3
Material Physics: Real themed objects, accurate materials, consistent matte finish, soft shadows ::2
Illumination: Flat overhead softbox, no glare ::2
Typography: Tiny frequency labels along the lower edge ::2
Render Stack: Density-map flat-lay, frequency-packed collection, data-viz arrangement, 8k ::1
Negative: [uniform spacing, mismatched density, broken silhouette, total overlap, tilt, 3d perspective, hands] ::-1
How to use
Replace [THEME] with the theme you want to display, and use [SHAPE] to specify the silhouette formed by the density distribution.